If you’re the kind of person who reads this blog, then you won’t have missed yesterday’s announcement of the first Planck cosmology results.
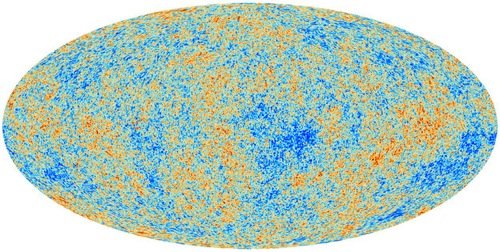
The most important is our picture of the cosmic microwave background itself:

But it takes a lot of work to go from the data coming off the Planck satellite to this picture. First, we have to make nine different maps, one at each of the frequencies in which Planck observes, from 30 GHz (with a wavelength of 1 cm) up to 850 GHz (0.350 mm) — note that the colour scales here are the same:


At low and high frequencies, these are dominated by the emission of our own galaxy, and there is at least some contamination over the whole range, so it takes hard work to separate the primordial CMB signal from the dirty (but interesting) astrophysics along the way. In fact, it’s sufficiently challenging that the team uses four different methods, each with different assumptions, to do so, and the results agree remarkably well.
In fact, we don’t use the above CMB image directly to do the main cosmological science. Instead, we build a Bayesian model of the data, combining our understanding of the foreground astrophysics and the cosmology, and marginalise over the astrophysical parameters in order to extract as much cosmological information as we can. (The formalism is described in the Planck likelihood paper, and the main results of the analysis are in the Planck cosmological parameters paper.)
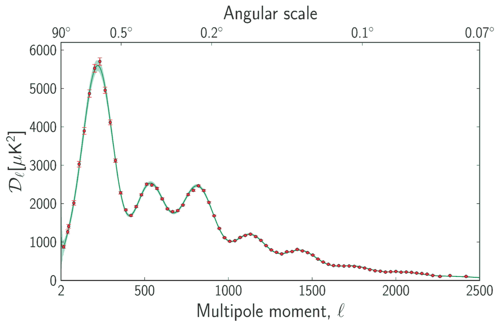
The main tool for this is the power spectrum, a plot which shows us how the different hot and cold spots on our CMB map are distributed:

In this plot, the left-hand side (low ℓ) corresponds to large angles on the sky and high ℓ to small angles. Planck’s results are remarkable for covering this whole range from ℓ=2 to ℓ=2500: the previous CMB satellite, WMAP, had a high-quality spectrum out to ℓ=750 or so; ground- and balloon-based experiments like SPT and ACT filled in some of the high-ℓ regime.
It’s worth marvelling at this for a moment, a triumph of modern cosmological theory and observation: our theoretical models fit our data from scales of 180° down to 0.1°, each of those bumps and wiggles a further sign of how well we understand the contents, history and evolution of the Universe. Our high-quality data has refined our knowledge of the cosmological parameters that describe the universe, decreasing the error bars by a factor of several on the six parameters that describe the simplest ΛCDM universe. Moreover, and maybe remarkably, the data don’t seem to require any additional parameters beyond those six: for example, despite previous evidence to the contrary, the Universe doesn’t need any additional neutrinos.
The quantity most well-measured by Planck is related to the typical size of spots in the CMB map; it’s about a degree, with an error of less than one part in 1,000. This quantity has changed a bit (by about the width of the error bar) since the previous WMAP results. This, in turn, causes us to revise our estimates of quantities like the expansion rate of the Universe (the Hubble constant), which has gone down, in fact by enough that it’s interestingly different from its best measurements using local (non-CMB) data, from more or less direct observations of galaxies moving away from us. Both methods have disadvantages: for the CMB, it’s a very indirect measurement, requiring imposing a model upon the directly measured spot size (known more technically as the “acoustic scale” since it comes from sound waves in the early Universe). For observations of local galaxies, it requires building up the famous cosmic distance ladder, calibrating our understanding of the distances to further and further objects, few of which we truly understand from first principles. So perhaps this discrepancy is due to messy and difficult astrophysics, or perhaps to interesting cosmological evolution.
This change in the expansion rate is also indirectly responsible for the results that have made the most headlines: it changes our best estimate of the age of the Universe (slower expansion means an older Universe) and of the relative amounts of its constituents (since the expansion rate is related to the geometry of the Universe, which, because of Einstein’s General Relativity, tells us the amount of matter).
But the cosmological parameters measured in this way are just Planck’s headlines: there is plenty more science. We’ve gone beyond the power spectrum above to put limits upon so-called non-Gaussianities which are signatures of the detailed way in which the seeds of large-scale structure in the Universe was initially laid down.
We’ve observed clusters of galaxies which give us yet more insight into cosmology (and which seem to show an intriguing tension with some of the cosmological parameters). We’ve measured the deflection of light by gravitational lensing. And in work that I helped lead, we’ve used the CMB maps to put limits on some of the ways in which our simplest models of the Universe could be wrong, possibly having an interesting topology or rotation on the largest scales.
But because we’ve scrutinised our data so carefully, we have found some peculiarities which don’t quite fit the models. From the days of COBE and WMAP, there has been evidence that the largest angular scales in the map, a few degrees and larger, have some “anomalies” — some of the patterns show strange alignments, some show unexpected variation between two different hemispheres of the sky, and there are some areas of the sky that are larger and colder than is expected to occur in our theories. Individually, any of these might be a statistical fluke (and collectively they may still be) but perhaps they are giving us evidence of something exciting going on in the early Universe. Or perhaps, to use a bad analogy, the CMB map is like the Zapruder film: if you scrutinise anything carefully enough, you’ll find things that look a conspiracy, but turn out to have an innocent explanation.
I’ve mentioned eight different Planck papers so far, but in fact we’ve released 28 (and there will be a few more to come over the coming months, and many in the future). There’s an overall introduction to the Planck Mission, and papers on the data processing, observations of relatively nearby galaxies, and plenty more cosmology. The papers have been submitted to the journal A&A, they’re available on the ArXiV, and you can find a list of them at the ESA site.
Even more important for my cosmology colleagues, we’ve released the Planck data, as well, along with the necessary code and other information necessary to understand it: you can get it from the Planck Legacy Archive. I’m sure we’ve only just begun to get exciting and fun science out of the data from Planck. And this is only the beginning of Planck’s data: just the first 15 months of observations, and just the intensity of the CMB: in the coming years we’ll be analysing (and releasing) more than one more year of data, and starting to dig into Planck’s observations of the polarized sky.
One response to “Planck 2013: the science”
Planck 2013: the PR
Yesterday’s release of the Planck papers and data wasn’t just aimed at the scientific community, of course. We wanted to let the rest of the world know about our results. The main press conference was at ESA HQ in Paris, and there was a sma…